Novo Nordisk (NVO) - Is This The Accumulation Zone?
Ticker: NVO (Novo Nordisk A/S Sponsored ADR Class B)
Date of Analysis: November 24, 2025
Key Takeaway: Novo Nordisk is in a critical technical juncture following a significant correction from its all-time highs. The current price action suggests a potential accumulation phase, but key levels must be monitored to confirm the next major directional move.
Chart Overview: A Market in Transition
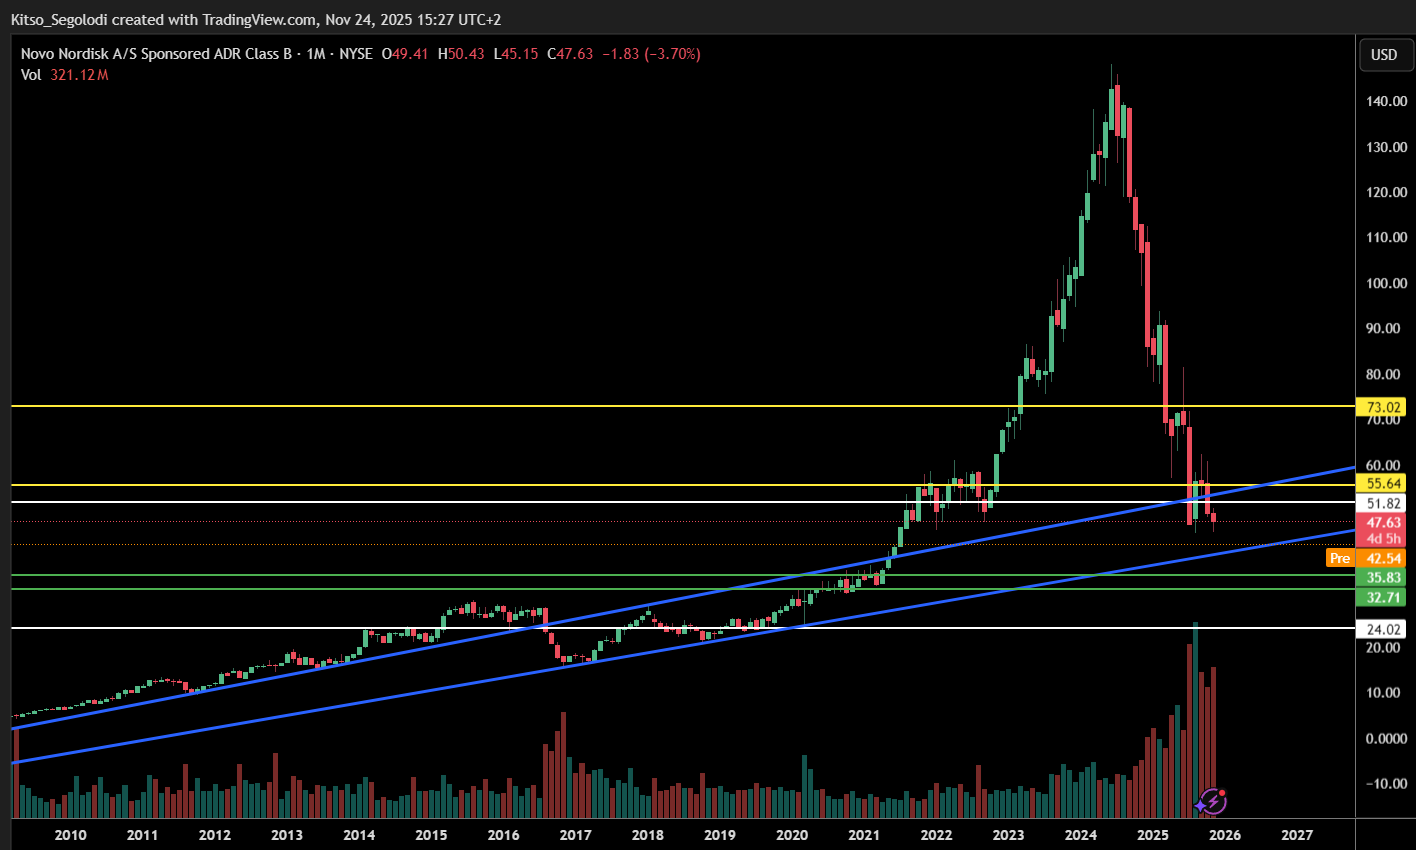
After a historic parabolic rally that propelled NVO to nearly $140, the stock has undergone a sharp and necessary correction. This has invalidated the long-term bullish trendline and shifted the primary trend from unequivocally bullish to neutral, at least in the short to medium term. The stock is now searching for a stable foundation from which to build its next leg.
The high volume (321M shares) during this decline indicates a period of distribution (selling by weak hands), but the subsequent basing around the $47 level hints that the process of accumulation (buying by strong hands) may be beginning.
Critical Price Levels to Watch
1. Resistance (The Ceiling)
- $51.82 - $55.64 Zone: This is the most immediate and critical resistance barrier. A decisive break and close above $55.64 would be the first strong technical signal that buyers have regained control and that a move toward higher prices is likely. Until this level is reclaimed, the path of least resistance remains neutral to the downside.
2. Support (The Floor)
- Immediate Support: ~$40.50: This is the recent low. A break below this level would signal that the current consolidation is failing and would likely trigger a move toward the next major support zone.
- Major Historical Support: $35.83 - $32.71: This is the high-probability accumulation zone. $35.83 was a formidable resistance level throughout 2020-2021, which should now reverse its role as strong support. A drop into this zone would present a potentially high-conviction buying opportunity for long-term investors, given Novo Nordisk's fundamental strength.
Strategic Outlook & Price Targets
- Near-Term (1-3 Months): The stock is likely to remain volatile and range-bound between $40.50 and $55.64. Traders should watch for a breakout in either direction for a clearer short-term signal.
- Medium to Long-Term (6-12 Months):
- Bullish Scenario: A sustained break above $55.64 opens the door for a rally toward $73.00. This would represent a significant recovery and reaffirm the long-term bullish narrative.
- Bearish Scenario: A failure to hold $40.50 could see a decline to test the primary support zone between $35.83 and $32.71.
Investment Strategy: Navigating the Uncertainty
Given the current technical uncertainty, a single large entry is highly speculative. A more prudent approach is recommended:
- Dollar-Cost Averaging (DCA): This is the optimal strategy at this juncture. By allocating capital in increments, investors can build a position without the pressure of timing the exact bottom. This is particularly effective for a fundamentally sound company like Novo Nordisk undergoing a technical correction.
- Tiered Entry Plan:
- Initiate or add to a position on bounces that hold above $47.
- Increase allocation significantly if the stock dips into the high-probability $35.83 - $32.71 support zone.
- Add final tranches on a confirmed breakout above $55.64.
Bottom Line
Novo Nordisk is at a crossroads. The dramatic fall from its peak has shaken out speculative excess, creating a more attractive entry point for patient investors. While the breakdown is technically concerning, the company's underlying fundamentals in the GLP-1 market remain robust.
Watch the levels: The battle between bulls and bears will be decided at $55.64 to the upside and $40.50 to the downside. A break in either direction will dictate the next major move. For now, discipline and a DCA strategy provide the best framework for capitalizing on this volatility.
Disclaimer: This is technical analysis and should not be taken as standalone investment advice. Always conduct your own due diligence and consider your risk tolerance before making any investment decisions. Past performance is not indicative of future results.