Pure Storage (PSTG): A High-Stakes Test at Critical Support
In the volatile world of tech stocks, rapid declines often create the most compelling opportunities. Pure Storage (PSTG) presents a textbook case, having shed over 30% from its recent highs to arrive at a critical technical juncture.
The market is now asking a single, urgent question: Is this a collapse or a contrarian setup?
Our analysis of the weekly chart reveals that the answer hinges on a precise price zone and the integrity of a key trendline.
The Immediate Bullish Signal: Holding $67.57
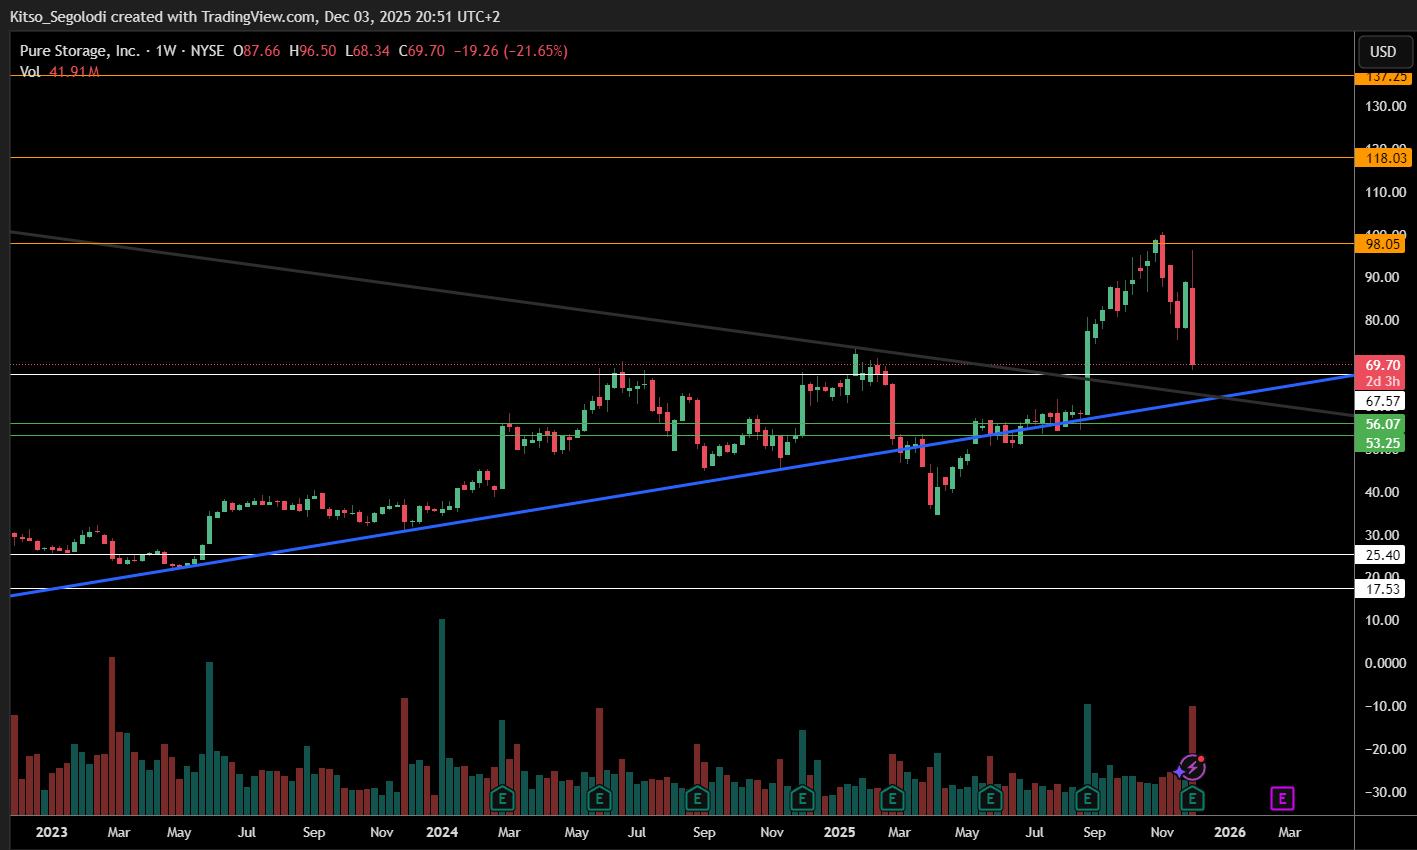
The fact that price is trading above $67.57 is the first positive sign. This level is now the immediate support to watch. A sustained hold here, especially on a weekly closing basis, suggests the aggressive selling may be exhausting and that this level is flipping from resistance to support.
The Deeper Safety Net: The Trendline Confluence
The primary, high-conviction support zone remains lower, between the major ascending blue trendline and the $53 - $56 price area. This is the bullish fortress. A successful test of the $67.57 level that leads to a rally would make this zone a secondary safety net. However, any break below $67.57 would bring this major support confluence squarely into focus.
The Price Pathway
As long as price holds above $67.57, the structure favors a bullish resolution with the following projections:
- Initial Target: $98
- Medium-Term Target: $118
- Long-Term Target: $137
The invalidation of the bullish structure is now a two-stage process:
- First Warning: A break back below $67.57.
- Full Breakdown: A subsequent weekly close below the $53 trendline support.
The Strategic Takeaway
PSTG offers a high-risk, high-reward setup defined by clear technical levels.
| Scenario | Trigger | Target 1 | Target 2 | Invalidation |
| Bullish Momentum | Hold & bounce from $67.57 | $98 | $118 | Close < $67.57 |
| Bullish Reversal (Deep) | Hold & bounce from $53-56 | $98 | $118 | Close < $53 |
| Bearish Continuation | Close < $53 | $45 | $40 | N/A |
Bottom Line: The setup has evolved. Bulls are currently defending $67.57. This level is now the linchpin for a near-term recovery. Watch for a strong weekly close above $69.50 (current price) to confirm strength, with a break below $67.57 as the signal to shift focus to the deeper $53-56 support zone.
Disclaimer: This analysis is for informational purposes only and does not constitute financial advice.