Tesla Breaks Key Resistance: Is $529 the Next Stop?
Technical analysis suggests TSLA's recent breakout could be the start of a new leg higher, but these are the critical levels bulls must defend.
After a period of consolidation, Tesla (TSLA) is showing signs of reigniting its bullish engine. A decisive close above a critical technical level suggests that buyers are stepping back in, potentially setting the stage for a significant move toward higher prices. Let's break down the key chart levels every trader should be watching.
The Bullish Breakout: Power Above $415
For the past several sessions, Tesla has been building a base around the $405 level. This consolidation served as a crucial coiling period, absorbing selling pressure and building energy for its next move.
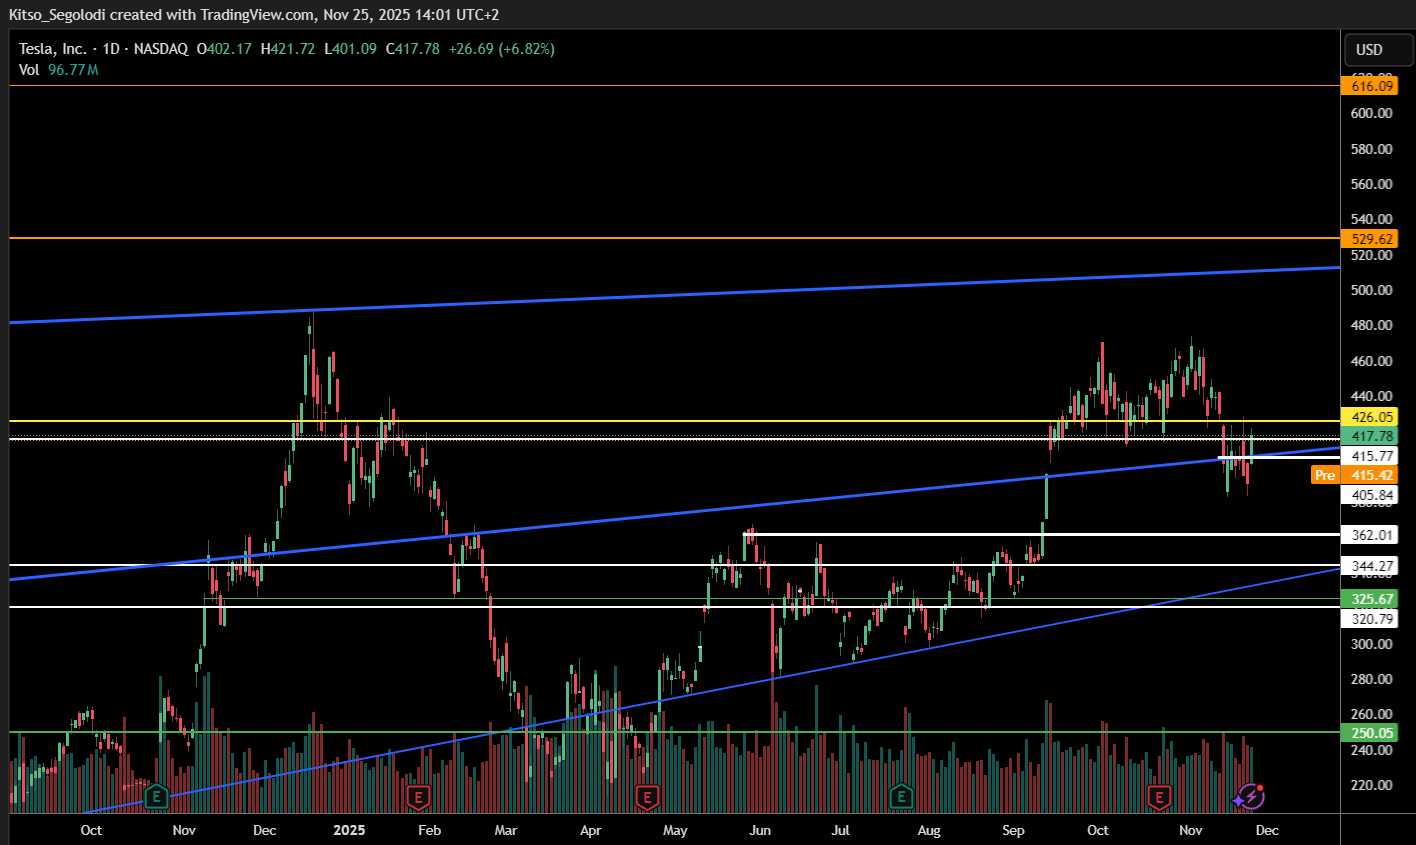
The most significant development is the stock's recent close at $417.78, firmly breaking above the $415.77 resistance. This isn't just a minor level; it was the ceiling of the recent trading range. A sustained move above this zone signals that the balance of power has shifted, at least temporarily, in the bulls' favor.
The immediate challenge now is to convert this former resistance into a new support floor. If it can hold above $415, the path of least resistance points upward.
The Roadmap Higher: Targets and Resistance
With the breakout confirmed, the technical picture projects a clear path for a continued rally.
- Initial Target: $480. A successful hold above the breakout zone opens the door for a run toward the $480 level, which represents the next significant area of supply on the chart.
- Primary Medium-Term Target: $529. This is the most significant technical target. This level marks the previous high from early 2025, and a breach here would signal a full resumption of the long-term uptrend and could potentially unlock a move toward more ambitious targets like $600.
The Bull Case and the Safety Net
While the breakout is encouraging, no trend moves in a straight line. Pullbacks are a natural part of any advance, and for Tesla, they present potential opportunities.
Our analysis identifies a high-probability "Bull Support Zone" between $344 and $362. This area is a confluence of several technical factors, including a prior swing high and the rising trendline. Any dip into this zone would likely see strong buying interest from bulls who missed the initial breakout, making it an ideal area for adding or initiating positions.
Risk Management: The Line in the Sand
A bullish outlook must always be tempered with disciplined risk management. The current breakout thesis would be invalidated by a failure to hold support.
- The breakout is voided if the stock falls back and sustains trading below $392.
- A more significant bearish warning signal would be a breakdown below the major $344 support level. Such a move would suggest a deeper correction is underway, and the bullish scenario should be reassessed.
The Bottom Line
Tesla's breakout is a technically sound reason for bullish optimism. The move above $415 provides a clear signal, while the defined targets at $480 and $529 offer a strategic roadmap.
The Strategy: Bulls can consider the breakout a green light, with a dip into the $362-$344 zone representing a high-conviction buying opportunity. As always, position sizing and strict adherence to stop-loss levels below key supports are essential to navigate the inherent volatility.
Disclaimer:This analysis is based on technical price action and should not be considered financial advice. Always conduct your own research and consider your risk tolerance before making any investment decisions.