The Nike ($NKE) Pivot Point: A Technical Deep Dive into the Make-or-Break $62 Zone
In the world of investing, certain charts tell a story not just of price, but of sentiment, structure, and potential. The Nike ($NKE) weekly chart is currently telling one of the most compelling stories in the market. After a significant downtrend, the stock has arrived at a technical crossroads that could define its trajectory for the next 6-12 months.
For investors and traders alike, understanding this pivotal moment is crucial. This isn't about short-term noise; it's about identifying a high-probability, defined-risk setup with significant implications.
The Scene of the Battle: A Confluence of Critical Support
Nike's price action has brought it to a rare convergence of two powerful technical elements:
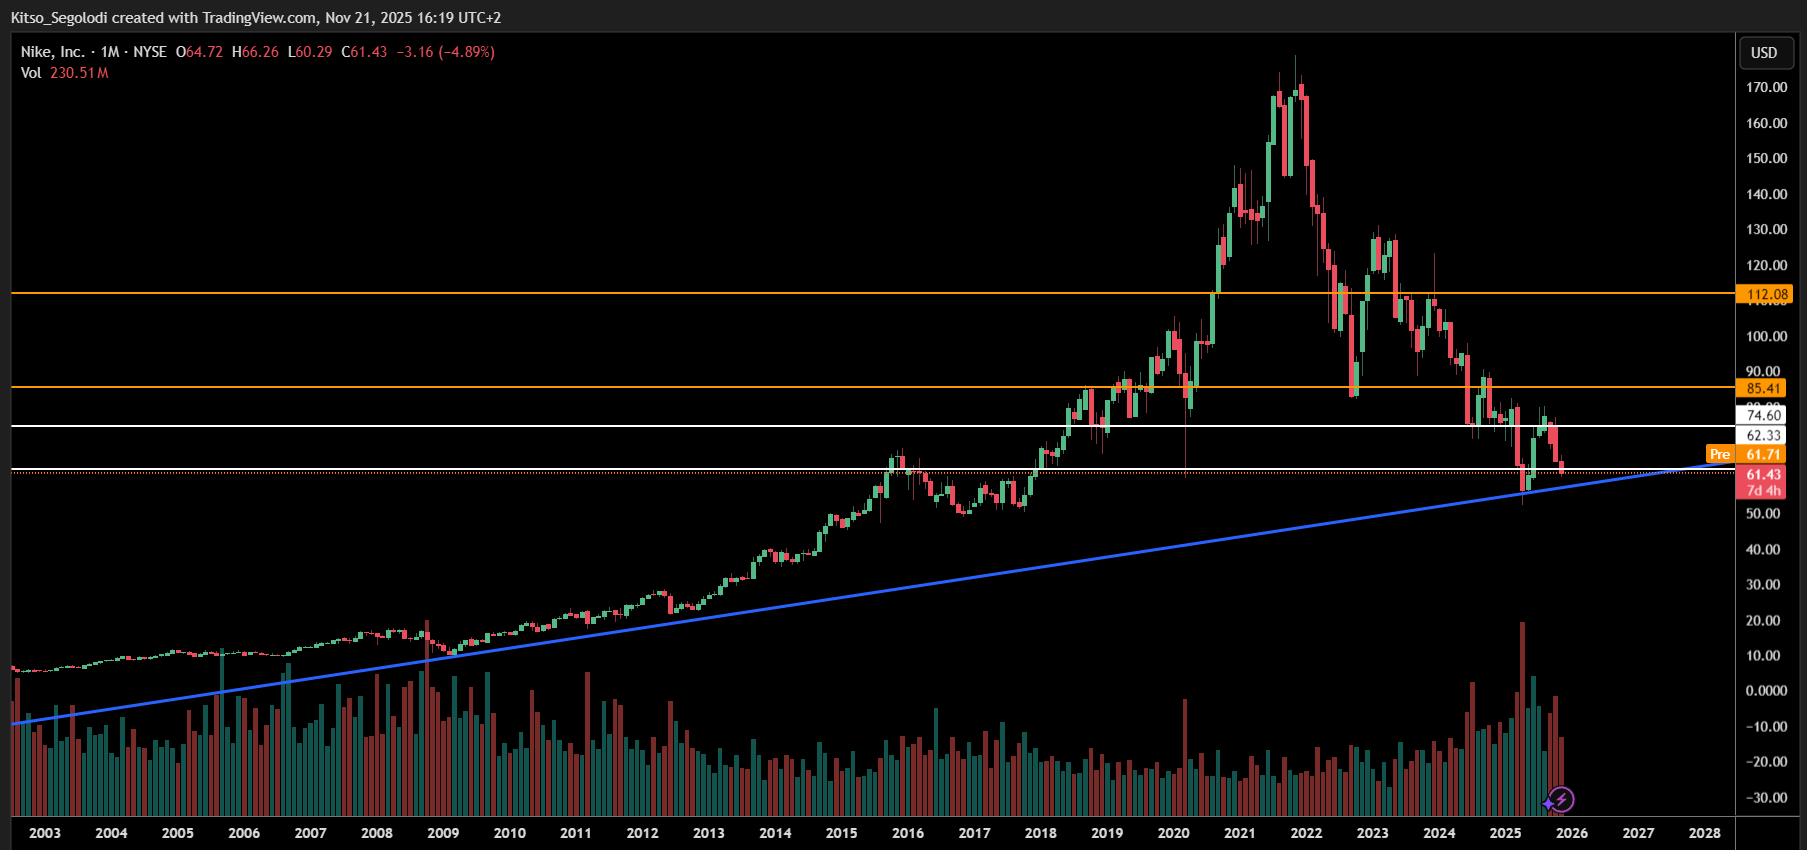
- The Multi-Year Ascending Trendline: This is the blue line on the chart, connecting the pivotal lows from the COVID crash through the 2022 and 2023 lows. This trendline represents the very foundation of Nike's long-term bull market. It’s the line in the sand that has supported every major advance for years.
- The $62.33 Key Level: This price is not arbitrary. It represents the immediate gateway for a confirmed bullish reversal. A decisive weekly close above this level would signal a break in the current downtrend's structure, confirming that momentum has shifted. This breach would serve as the potential springboard, activating the next leg toward our initial target of $74.60.
The convergence of these two factors—the dynamic trendline support and the static price-level support creates a high-density support cluster between approximately $60 and $62.50. This is the zone where buyers are most likely to make a stand.
The Bullish Case: The Setup for a Powerful Reversal
Our bias is tactically bullish, contingent on price holding this zone. The rationale is based on classical technical principles:
- The "Last Stand" of the Bulls: If the long-term uptrend is to remain valid, this is precisely where institutional buying should emerge. The deep sell-off has shaken out weak hands, potentially creating a coiled-spring effect.
- The Break and Retest Pattern: A strong weekly close above $62.33 would be our confirmed bullish trigger. It would signal that the support has held and that buyers have seized control. This would open the path for a structured recovery.
Bullish Price Projection (If support holds and $62.33 is reclaimed):
- Initial Target: ~$74.60 - This represents the first major resistance level and would constitute a 20% rally from current levels. A move here would break the pattern of lower highs and confirm a new bullish phase.
- Medium-Term Target: ~$85.41 - This is the next significant hurdle, representing a full recovery of the recent downtrend and a test of the 2024 highs.
- Long-Term Cyclical Target: $112 - $120 - This ambitious target aligns with the all-time high region. Achieving this would likely require a fundamental catalyst (e.g., a blockbuster product cycle, margin expansion, or a shift in market sentiment towards growth stocks) in addition to the technical breakout.
The Bearish Risk: The Line in the Sand
A professional analyst must always define failure. Our bullish thesis is not unconditional. The critical support zone is a fortress wall; if it falls, the consequences are severe.
Our invalidation level is a sustained break, particularly a weekly close, below the primary blue trendline (currently near $60).
Why is this so critical?
- Trend Breakdown: It would signify a break in the multi-year bullish trend, fundamentally altering the stock's market structure.
- Target for a Deeper Decline: A breakdown would project a move toward the next major support zone, which sits in the $50 - $55 range. This would represent a further 15-25% decline from current levels.
A break below this level would force us to abandon our bullish stance and reposition to a neutral or bearish outlook until a new base of support is established.
The Integrated Trade Plan
For active investors, this setup provides a clear framework for action.
| Scenario | Trigger | Target 1 | Target 2 | Invalidation |
| Bullish | Weekly close > $62.33 | $74.60 | $85.41 | Break below Trendline (~$60) |
| Bearish | Weekly close < $60.00 | Reposition | Reassess | N/A |
Strategic Takeaways:
- For the Bullish Investor: The current zone offers a potential accumulation area. A confirmed weekly close above $62.33 provides a stronger entry signal.
- For the Cautious Observer: Wait for the confirmation. Let the market show its hand before committing significant capital.
- For Everyone: Define Your Risk. Know that a break below $60 is your signal to step aside. This turns a hopeful investment into a disciplined trade.
Final Analysis
Nike is at a watershed moment. The technical picture presents a high-reward opportunity with a clearly defined level of risk. While the fundamental story around consumer spending and competition remains a factor, the charts are signaling that a resolution is near.
We remain cautiously bullish, watching for buyers to defend the $60-$62.50 fortress. A successful defense and breakout could ignite a powerful rally. However, we respect the trendline. If it breaks, the narrative shifts dramatically.The market is giving us a roadmap. It’s our job to read it, plan accordingly, and manage our risk no matter which path $NKE decides to take.
Disclaimer: This analysis is for informational and educational purposes only and does not constitute a recommendation to buy, sell, or hold any security. Always conduct your own research and consider your individual risk tolerance before making any investment decisions. Past performance is not indicative of future results.